The question
Discover groups from Penguin measurements with species hidden during fitting. Combine k evidence with sizes and original-unit profiles.
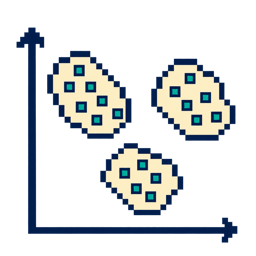
data/ml-learning/ML-X17.csv Complete workflow and evidenceYour inputs
Challenge input · ML-X17
333 observations. One measured penguin. Load the CSV file yourself.
Download challenge input CSV · Original source dataset · Source and original dictionary
Ready to load: comma-delimited UTF-8, header row, no saved index. No filtering or target construction is required. Fitting input contains measurements only; species/diagnosis reference labels are not supplied or required.
bill_length_mm | bill_depth_mm | flipper_length_mm | body_mass_g |
|---|---|---|---|
| 39.1 | 18.7 | 181 | 3750 |
| 39.5 | 17.4 | 186 | 3800 |
| 40.3 | 18 | 195 | 3250 |
| 36.7 | 19.3 | 193 | 3450 |
| 39.3 | 20.6 | 190 | 3650 |
| 38.9 | 17.8 | 181 | 3625 |
| 39.2 | 19.6 | 195 | 4675 |
| 41.1 | 17.6 | 182 | 3200 |
Column meanings and units
Bill length/depth and flipper length: mm. Body mass: grams. Year and island: sampling context.
ML uses 333 complete cases. Removing incomplete records may change the represented population. Geographic context may not generalise to new islands.
Ready to load: comma-delimited UTF-8, header row, no saved index. No filtering or target construction is required. Fitting input contains measurements only; species/diagnosis reference labels are not supplied or required.
| Column | Stored type |
|---|---|
bill_length_mm | float64 |
bill_depth_mm | float64 |
flipper_length_mm | int64 |
body_mass_g | int64 |
The file is available in the Python working folder. Load it yourself.
- Discover groups from Penguin measurements with species hidden during fitting.
- Combine
kevidencewithsizesand original-unitprofiles. - Plot bill length against bill depth in original units with labelled axes and distinct colours or markers for the aligned discovered groups.
evidencesizesprofileslabelsOutputs you create
evidence- Dataframe with
k,inertiaandsilhouettecolumns fork=2–8.
- Dataframe with
sizes- Group
sizesindexed by cluster label.
- Group
profiles- Original-unit means grouped by aligned cluster labels.
labels- One cluster label per fitted row; equivalent consistent label names are accepted.
Deliverables
These conditions describe a complete workflow. Use the declared Python variables beside the editor; Check inspects evidence from your Run.
Python name key
Teal outlines name table columns. Violet left rules name Python objects. Dotted rules mark syntax, functions and parameters. Use each name exactly as shown.
Words in this task
- original-unit
- shown in the measurement’s original units
- aligned
- matched by row or category identity, rather than guessed position
Discovery population
- Load the four supplied Penguin measurements and fit scaling to this declared population; no species labels enter fitting.
Compare groupings
- Compare
k=2–8 withinertia,silhouetteand geometry. - Justify a grouping without treating a score as proof of natural classes.
- Compare
Assignments & profiles
- Return one assignment per fitted row, group
sizesand aligned original-unitprofiles.
- Return one assignment per fitted row, group
Interpretation
- Explain the grouping and its limits using scores,
sizes, original-unitprofilesand a labelled measurement plot showing the discovered groups.
- Explain the grouping and its limits using scores,
The playground workflow
Use the ML → Workflow discovery route: define the observations and measurements, explore and prepare them, fit the grouping or representation, inspect its evidence and explain what the result can support. There is no prediction target or reserved final test in this workflow.
- Choose what to discoverWhat groups can I describe in Palmer Penguins · All features continuous rows using
bill_length_mm,bill_depth_mm, and 2 more selected inputs? - Explore the dataWhat ranges and overlaps among
bill_length_mm,bill_depth_mm, and 2 more selected inputs might shape groups in Palmer Penguins · All features continuous? - Prepare the dataHow should
bill_length_mm,bill_depth_mm, and 2 more selected inputs be scaled so distance comparisons treat Palmer Penguins · All features continuous rows fairly? - Compare possible group countsWhich candidate group count gives a useful balance for Palmer Penguins · All features continuous?
- Fit K-meansWhat does the selected starting group count produce for Palmer Penguins · All features continuous?
- Check the clustersAre the discovered Palmer Penguins · All features continuous groups separated enough and large enough to describe?
- Explain the clustersWhat do these groups look like in the original units of
bill_length_mm,bill_depth_mm, and 2 more selected inputs for Palmer Penguins · All features continuous? - Map the clustersDescribe two groups in the original units of
bill_length_mm,bill_depth_mm, and 2 more selected inputs for Palmer Penguins · All features continuous; why is this grouping useful for the selected scenario?
Data policy Use only the supplied measurements for fitting. Keep group labels, scores and profiles aligned with the rows they describe.
Help Hints & explained solution
Choose the amount of help you need. Opening one hint does not reveal the others.
Hint 1 — Think
No score proves natural classes.
Hint 2 — Tools
StandardScaler, KMeans, silhouette_score and group profiles.
Revisit: Discovery checkpoint
Hint 3 — Approach
Combine geometry and scores with useful descriptions; state the chosen population and limitations.
Explained solution
This complete script replaces the editor contents. It includes the input setup and the workflow.
import numpy as np
import pandas as pd
df=pd.read_csv('data/ml-learning/ML-X17.csv')
from sklearn.preprocessing import StandardScaler
from sklearn.cluster import KMeans
from sklearn.metrics import silhouette_score
import matplotlib.pyplot as plt
import seaborn as sns
X=df[['bill_length_mm','bill_depth_mm','flipper_length_mm','body_mass_g']]
scaler=StandardScaler()
scaled=scaler.fit_transform(X)
rows=[]
for k in range(2,min(8,len(X)-1)+1):
    candidate=KMeans(n_clusters=k,n_init=20,random_state=42).fit(scaled)
    score=silhouette_score(scaled,candidate.labels_,sample_size=min(2000,len(X)),random_state=42)
    rows.append({'k':k,'inertia':candidate.inertia_,'silhouette':score})
evidence=pd.DataFrame(rows)
# Three is an illustrative choice to discuss against the evidence, not a unique optimum.
model=KMeans(n_clusters=3,n_init=20,random_state=42).fit(scaled)
labels=model.labels_
sizes=pd.Series(labels).value_counts().sort_index()
profiles=X.groupby(labels).mean()
fig,ax=plt.subplots(figsize=(6,4))
sns.scatterplot(data=X,x='bill_length_mm',y='bill_depth_mm',hue=labels,style=labels,ax=ax)
ax.set(xlabel='Bill length (mm)',ylabel='Bill depth (mm)',title='Exploratory Penguin groups')
ax.legend()
fig.savefig('clusters.png',dpi=150,bbox_inches='tight')
print(evidence)
View input setup in this script
These opening lines are included in the complete script above. They load the challenge input.
import numpy as np
import pandas as pd
df=pd.read_csv('data/ml-learning/ML-X17.csv')
Why these steps exist
- The primary file contains only the four measurements, so species cannot influence fitting or k selection. Standardised geometry supports the k comparison, while aligned original-unit profiles and sizes support interpretation. A defensible grouping need not maximise one score or represent natural classes.
Another valid approach
Equivalent ordinary Python is welcome. A defensible candidate or grouping need not match the solution’s choice; objective evidence must remain consistent.